
Maps of Solar Eclipses from 1654 to 1699
“Zonsverduistering van 12 augustus 1654”, Anonymous. Source is Rijksmuseum.nl, http://hdl.handle.net/10934/RM0001.COLLECT.180156
While solar eclipses were well understood in antiquity and correct diagrams of eclipses were made from the time of Claudius Ptolemy and earlier, it was not until the Age of Enlightenment when the earliest maps of the actual path of a solar eclipse on earth were created.
The emergence of eclipse maps represents the convergence of several advances in scientific thought -- the heliocentric model developed by Nicolaus Copernicus, Johann Kepler’s laws of planetary motions developed from Tycho Brahe’s measurements, and new geographic knowledge spanning the old and the new world with a system of longitude and latitude values.
The catalyzing factor that enabled the creation of the earliest eclipse maps was the publication of the Rudolphine Tables by Johannes Kepler in 1627. This was the first accurate ephemeris of the motions of the Sun, Moon, and planets, allowing future solar eclipses to be calculated more accurately.
Title and frontispiece of the Rudolphine Tables. Source is en.wikipedia.org/wiki/Rudolphine_Tables
Total Solar Eclipse of 1654 August 12
This is the earliest known map of a solar eclipse, created in 1654 as part of an academic disputation involving Erhard Weigel, professor at Universität Jena, and Andreas Gunther Seiffart, his student, on the subject of the astronomical theory of eclipses. It was published shortly before eclipse day. The path of totality crosses Britain, Central Europe, and Persia. The progressing black dots depict the umbra where totality can be seen. The broad circles show where — from the perspective of the Moon — the penumbra (outer shadow) crosses the Earth.
Erhard Weigel
Title: “ECLIPSIS TERRAE MAGNA D. 2. AUGUSTI, 1654 È LUNA VISIBILIS”.
Volume: Secundae Partis Geoscopiae Selenitarum Disputatio Secunda De Eclipsibus
Source: Universität Jena, https://collections.thulb.uni-jena.de/rsc/viewer/HisBest_derivate_00012262/VD17-40689891X_0003.tif.
Weigel’s 1654 eclipse map compares well with modern reconstructions. This view is quite logical — it is the view from an observer on the Moon looking at the eclipse progressing on the Full Earth. The map includes the Earth’s 23 degree axial tilt.
Five moments of penumbral shadow are shown as circles from left to right:
First external contact of the penumbral shadow and Earth
First internal contact of the umbral shadow (where totality is seen) and the Earth
Moment of greatest eclipse, marked by a black dot on the Crimean peninsula
Last internal contact, when the umbral shadows lifts off in the Indian Ocean
Last external contact, when the penumbral shadow lifts off Earth
This modern recreation of Weigel’s 1654 eclipse map shows a striking match in the major geographic features occulted by the Moon’s shadow. Orthographic map projection, Michael Zeiler.
According to German historian of science Klaus-Dieter Herbst, this map of the total solar eclipse of August 12, 1654 was published by Erhard Weigel on the day before the eclipse!
The circles represent the shadow of the moon (penumbra) and the path of the total solar eclipse is the line annotated as “Via Umbra Luna”. A curious feature of this map is that the path of the eclipse is shown as a straight line instead of the sweeping arc which results from the combined motion of the moon’s shadow and the earth’s rotation about a tilted axis. This map can be best understood as a snapshot of the view of the Earth from the Moon during the middle of eclipse.

Cover page of disputation by Erhard Weigel containing the 1654 solar eclipse map. Source is Universität Jena. Erhard Weigel (1625-1699) was a German mathematician and astronomer in Jena (en.wikipedia.org/wiki/Erhard_weigel) and played an important role as an advocate for calendar reform in Germany. He also instructed Gottfried Wilhelm Liebniz, one of the inventors of the calculus, at Jena University.
Annular Solar Eclipse of 1676 June 11 &
Total Solar Eclipse of 1676 December 5
Johann Christoph Sturm
Volume: Fernere unfehlbare Begebenheiten Himmels Sricheinungen
Source: https://zs.thulb.uni-jena.de/servlets/MCRFileNodeServlet/jportal_derivate_00203108/K_1676_6b.pdf
This map by Johann Christoph Sturm in 1676 is the second earliest known eclipse map. This map was included in a 34-page almanac called the Finsternissen-Kalender für das Jahr 1676. Sturm was a student of Erhard Weigel at the Universität Jena.
The top map depicts the annular solar eclipse of 1676 June 11 and the bottom depicts the total solar eclipse of 1676 December 5.
The Moon’s outer shadow — its penumbra — is marked on both maps progressing from the begin to ending of its passage.
Recreation of Sturm’s 1676 eclipse map by Michael Zeiler


The circular shaded areas are the penumbral shadows on Earth at the four contacts of eclipse and moment of greatest eclipse.
Sturm’s eclipse maps employ the stereographic map projection, well suited for mapping the entire track of the eclipse. Orthographic maps, such as the summary globes in this section, have considerable distortion at the begin and ending of the eclipse tracks. The stereographic projection has the advantageous property of unwrapping the globe to the extent needed to span the entire eclipse track.
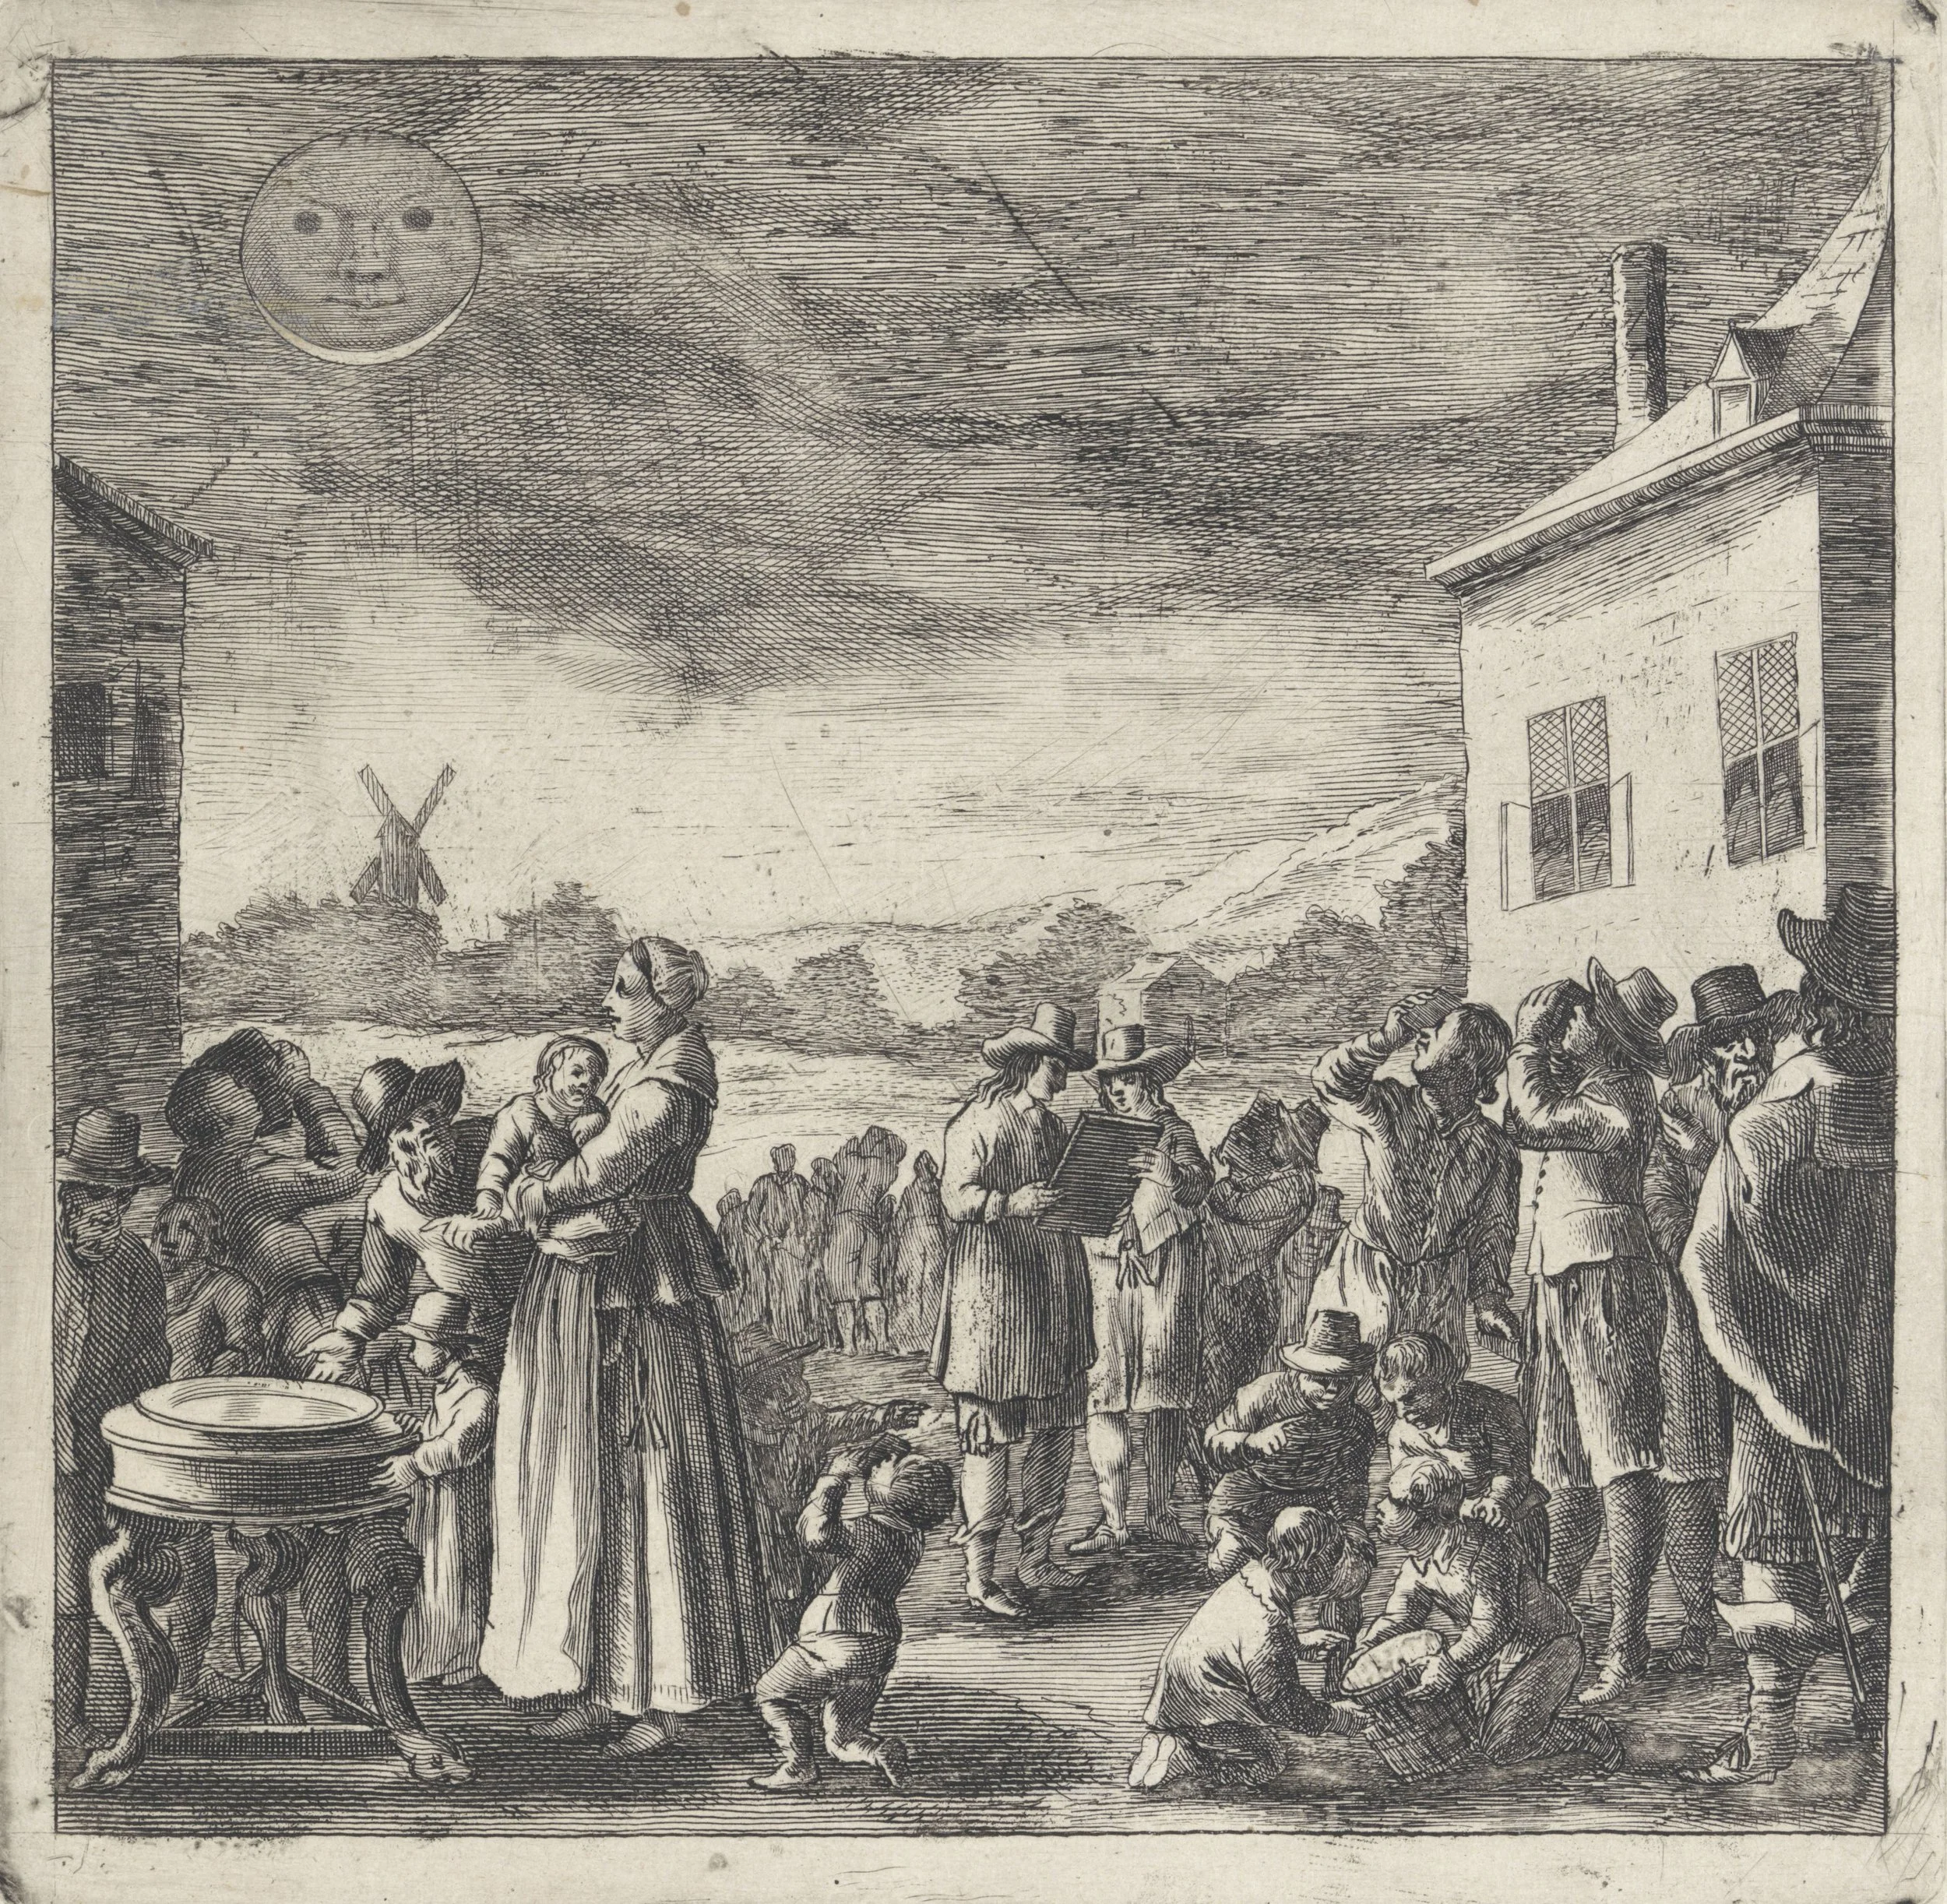
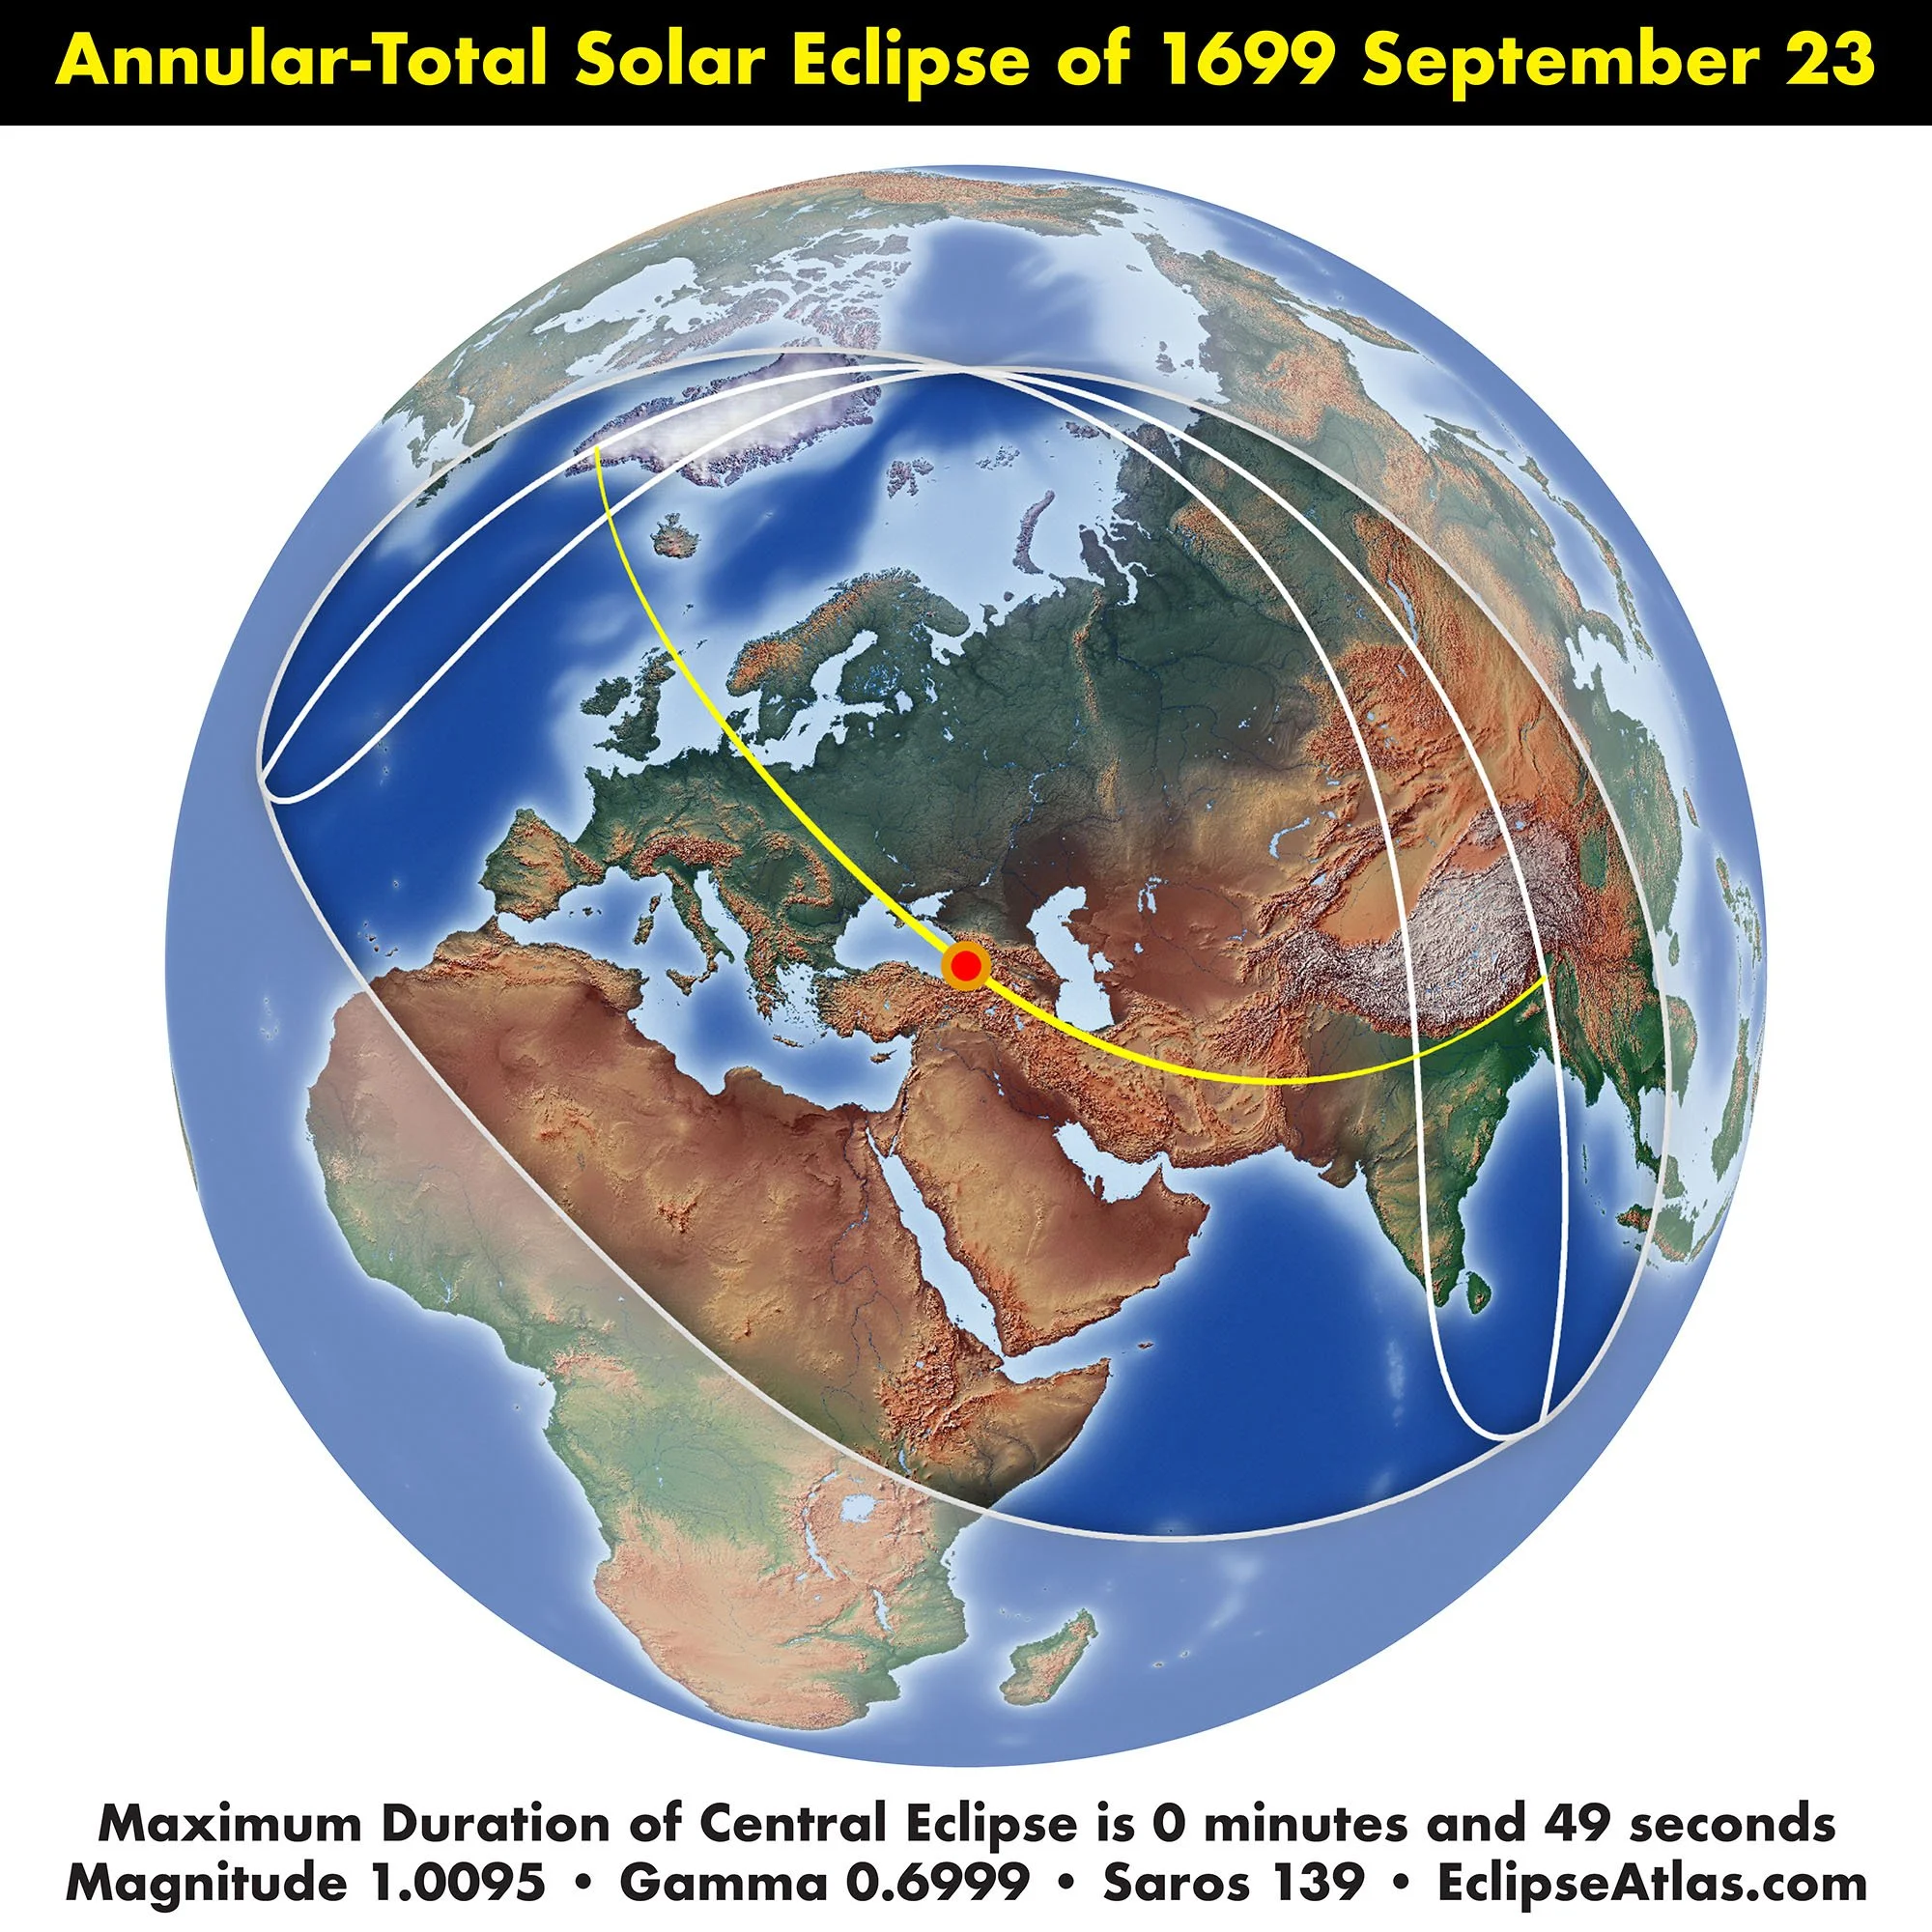
Annular-Total Solar Eclipse of 1699 September 23
Giovanni-Dominico Cassini
Volume: Histoire de l’Académie Royale des Sciences avec les mémoires de mathématique & de physique tirez des registres de cette Académie pour l’année MDCXCIX (Paris, 1700).
Source: Collection of Michael Zeiler.
This modern recreation and Cassini’s map compare well. The outer extent of the penumbral shadow
Another early innovator of early eclipse maps was Giovanni-Dominico Cassini (1625-1712). In 1700, Cassini published a retrospective map of the eclipse of 1699 September 23. This was the most accurate eclipse map up to this date and begins to resemble modern eclipse maps.
Cassini’s map is the first to delineate the outer extent of the Moon’s penumbral passage across a hemisphere of Earth.
Another important feature of this map is the introduction of isomagnitudes (lines of equal maximum eclipse) in solar eclipse maps. In this era, the obscuration of the sun by the moon during an eclipse was measured in parts of 12 and called digits (doigts in French). This map contains curves labelled “6 doigts”, or 6/12th maximum eclipse, “5 doigts”, or 5/12th maximum eclipse, and “12 doigts”, the path of the total solar eclipse.
This convention of dividing the maximum eclipse into intervals of twelve “digits” began in antiquity and endured well into the 19th century and appears in maps from Germany, England, France, the Netherlands, Czech Republic, and the United States. This practice persisted until the early 20th century and was gradually replaced by eclipse maps displaying curves of equal magnitude (isomagnitude) in decimal intervals such as 10% or 1%.

Giovanni-Dominico Cassini is also famous for discovering four of Saturn’s moons and noted the gap in Saturn’s rings now called the Cassini Division.
NASA’s mission to Saturn is named the Cassini spacecraft. This flagship mission orbited Saturn and its moons for 13 years . A key discovery was the moon Enceladus being covered in ice with evidence for an ocean underneath the ice. This ocean is a tempting target for astro-biologists.
Giovanni-Dominico Cassini Source: https://en.wikipedia.org/wiki/Giovanni_Domenico_Cassini