
Maps of Solar Eclipses from 1830 to 1834
The British government first began publishing The Nautical Almanac and Astronomical Ephemeris in 1766. These almanacs served navigators at sea by providing celestial data useful for converting sextant and chronometer readings into a geographic longitude.
A reorganization of the Nautical Almanac was undertaken for the year 1834 with the key enhancement being the adoption of Greenwich mean time for astronomical tables. In the report of the Almanac committee, several dozen recommendations for made for improvements including the establishment of eclipse maps. In 1834, the first eclipse map was published in the Nautical Almanac. The publication of these maps continues to the present day and in collaboration with the US Naval Observatory.
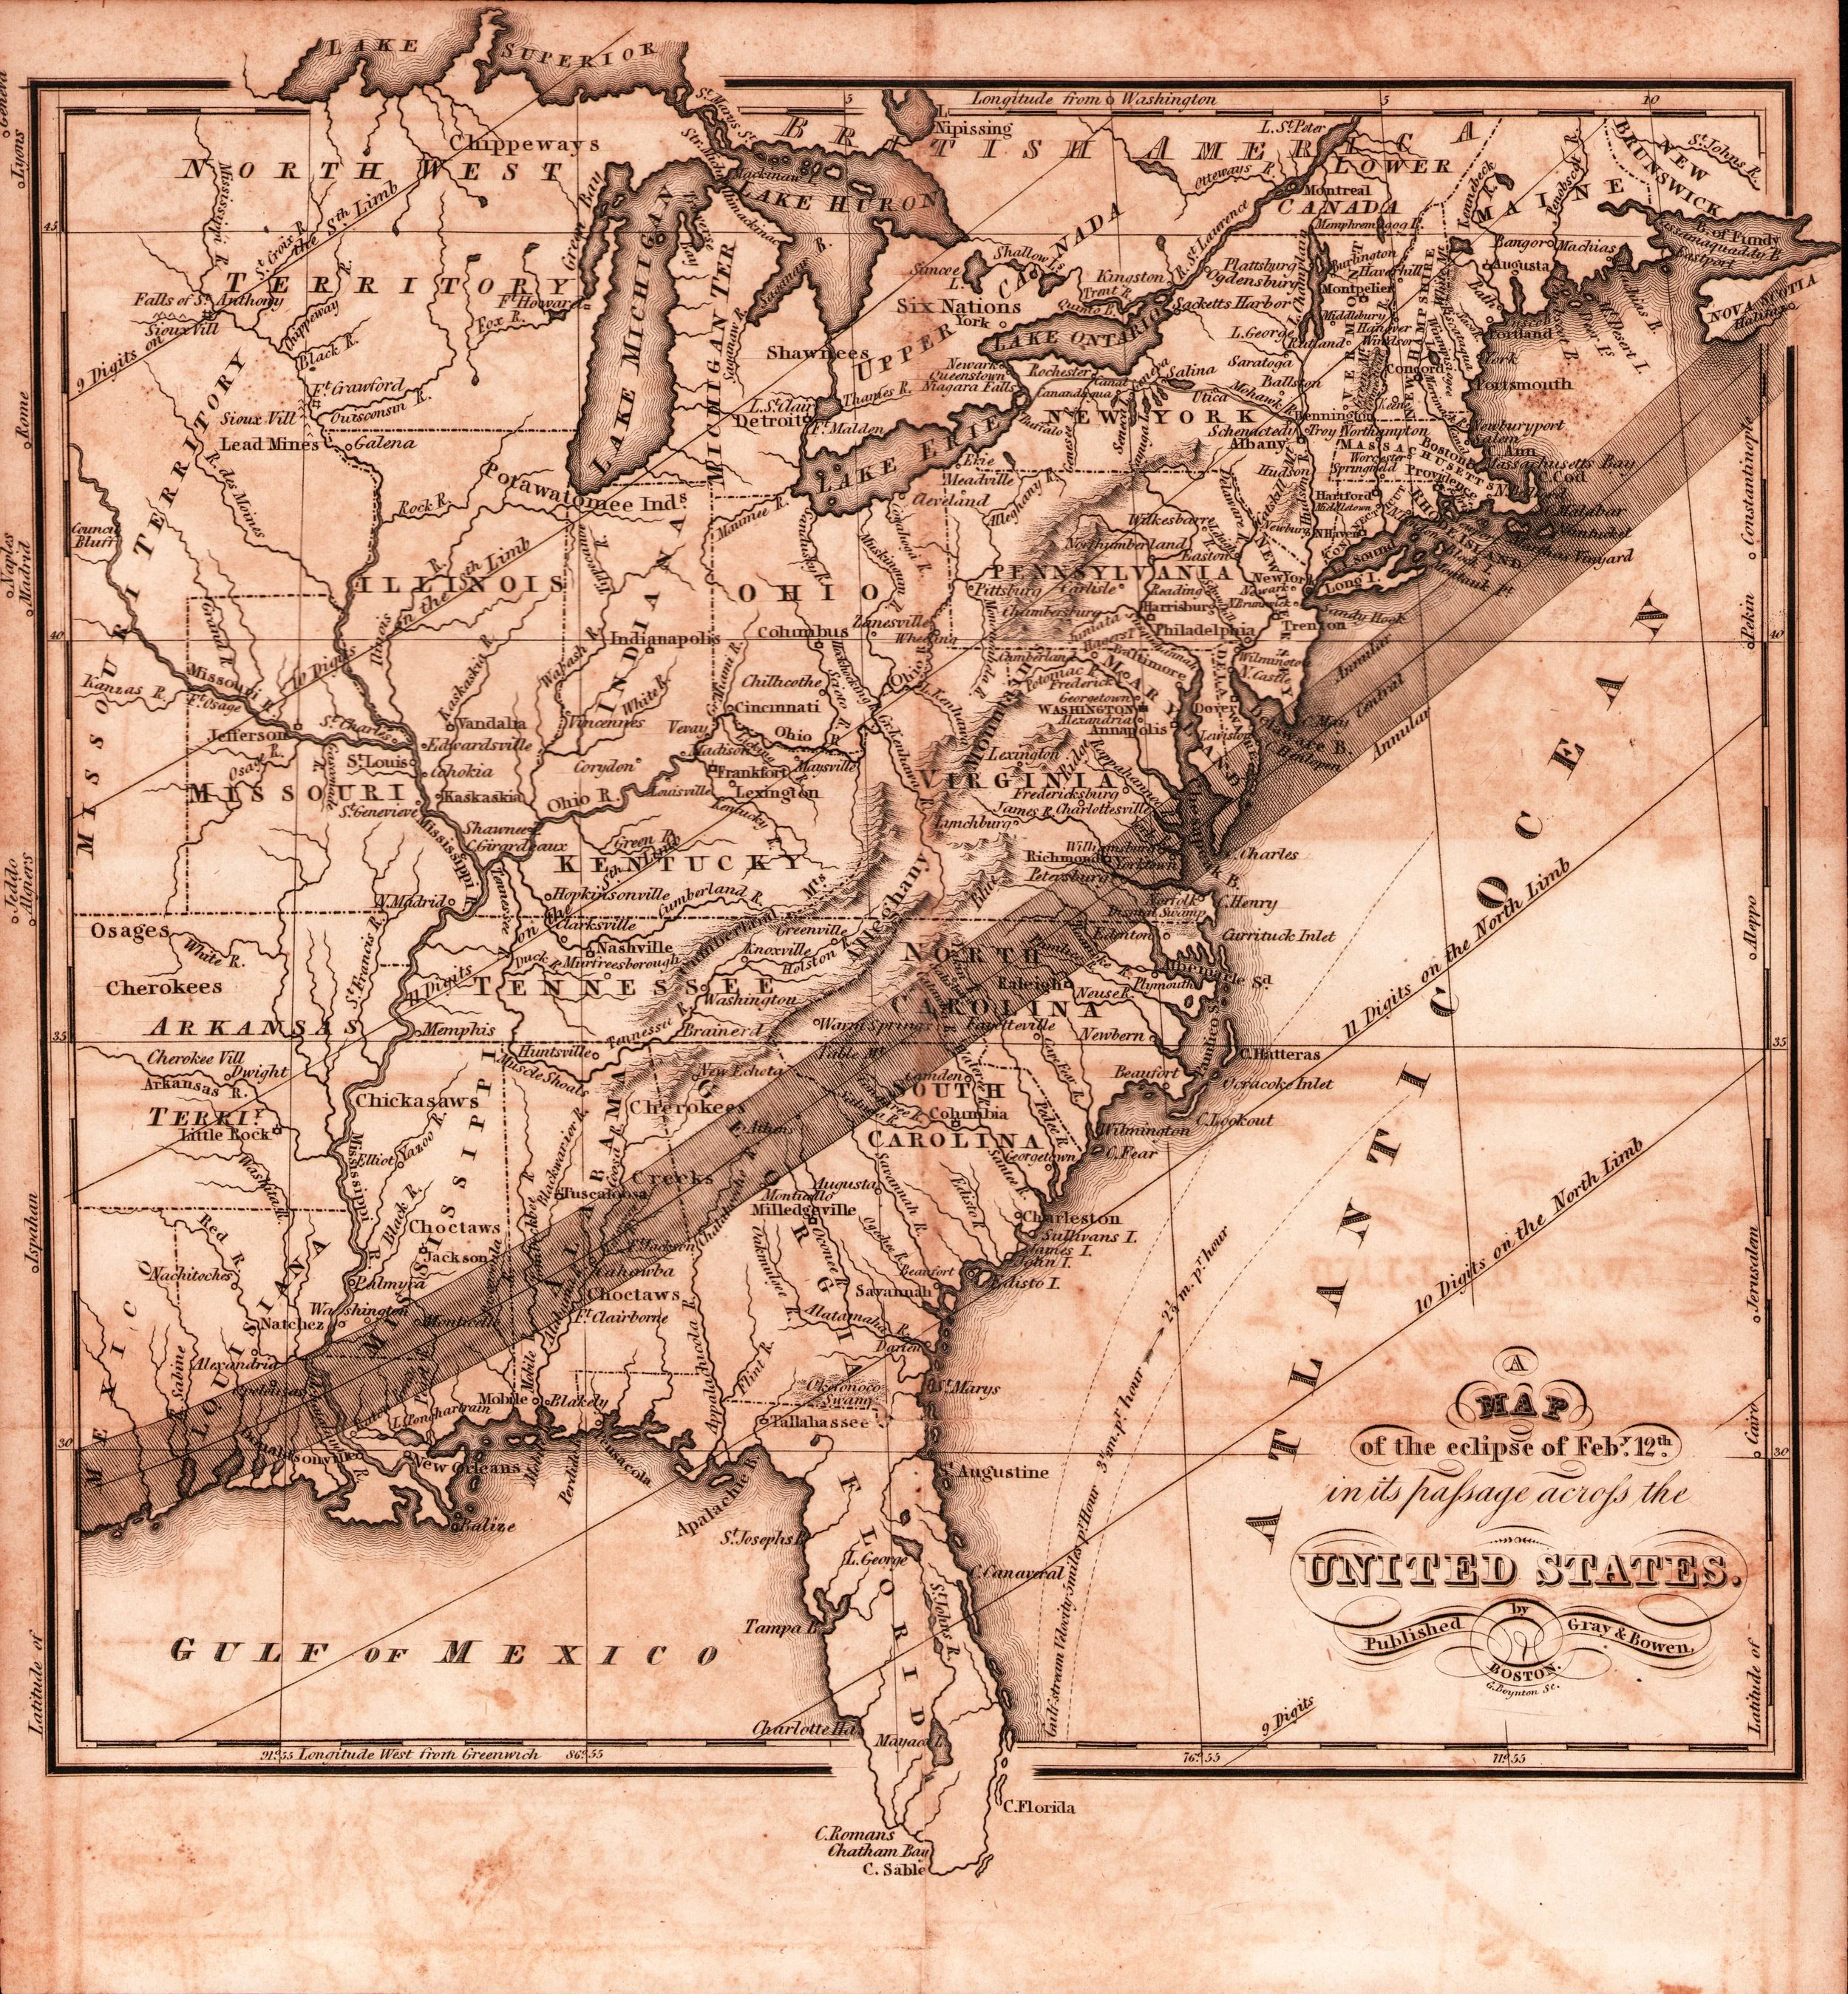
The first map of a solar eclipse published in the United States shows the path of annular solar eclipse from Texas through Nova Scotia. This map was published in the American Almanac and Repository of Useful Information for the year 1831.
The earliest known map of the path of a solar eclipse in an almanac appears in the American Almanac and Repository of Useful Information for the year 1831. This is also the earliest known American eclipse map and also the first map in an almanac.
This almanac was founded in 1830 by Jared Sparks, the 17th president of Harvard University and remained a popular annual publication until the 1860’s. Each almanac contained two parts, the first on celestial phenomena and the second with detailed information on the United States and Europe. While each edition contained detailed circumstances for eclipses, maps appeared only in the editions for the years 1831, 1834, and 1844. These maps are noteworthy for their fine cartographic detail of the young United States with the eclipse path and digit lines of the degree of partial eclipse.

Gray & Bowen A Map of the eclipse of Feby 12th in its passage across the United States American Almanac and Repository of Useful Information for the year 1831. Collection of Michael Zeiler


Cassian Hallaschka Occultatio Solis per Lunam die 17. Julii 1833 Elementa eclipsium quas patitur tellus, luna eam inter et solem versante, ab A.1816 usque ad A.1860 Collection of Michael Zeiler
A notable characteristic of the early eclipse maps in the Nautical Almanac is their application of map projection. For eclipses in the mid-latitudes, the Mercator projection was used and the stereographic projection was used for eclipses that span the polar regions.
Today, cartographers consider the Mercator projection to be a poor choice for world maps because of the severe distortion in the polar regions. Greenland appears to contain the same area as Africa whereas it has about one-seventh the land mass. In fact, the poles cannot be mapped at all because they are an infinite distance from the equator in the Mercator projection. Other map projections are preferred today for global maps, most notably the Mollweide, Robinson, and Winkel-Tripel projections.
However, the use of the Mercator projection can be understood within the Nautical Almanac because this projection has a special property for navigation: A straight line drawn on a map with Mercator projection defines a rhumb line, which is a line of constant bearing. A sailor can follow this constant bearing to easily navigate from one port to another.
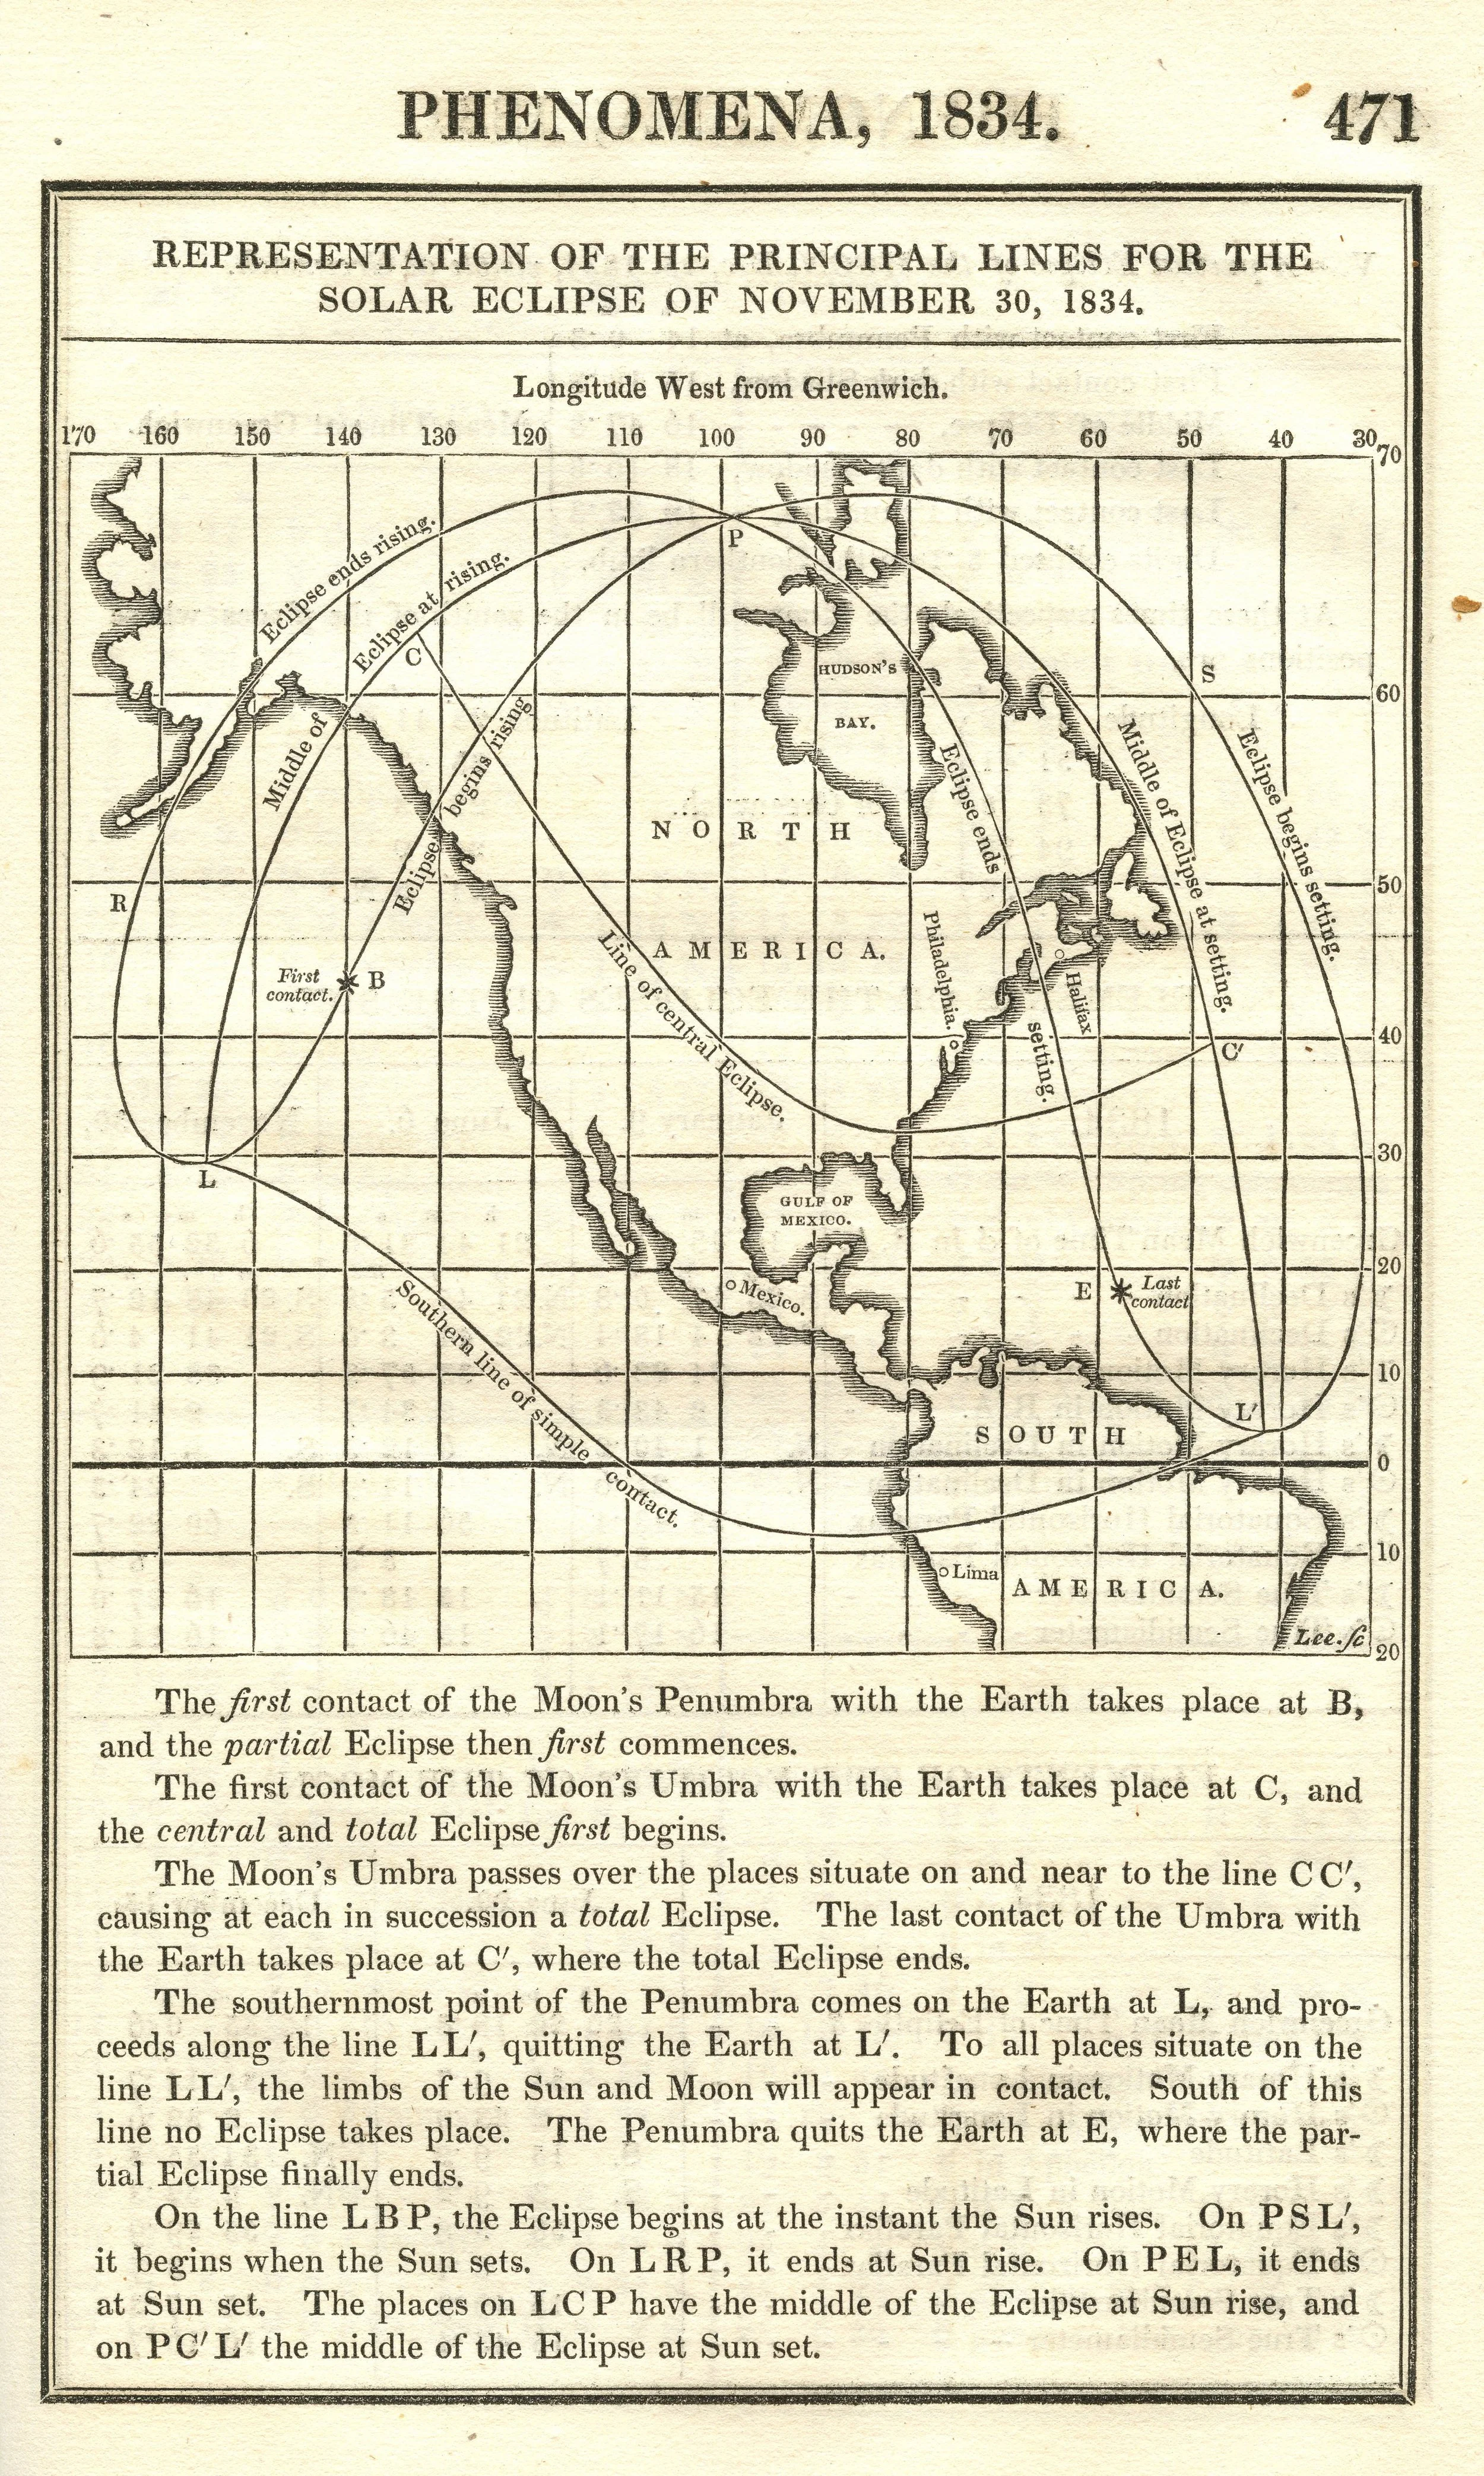
The Nautical Almanac and Astronomical Ephemeris Representation of the principal lines for the solar eclipse of November 30, 1834 Scanned at Federal Repository Library, UC Berkeley

Charles Bowen A Map of the eclipses of Feby 12th 1831 and Nov 30th 1834 in its passage across the United States American Almanac and Repository of Useful Information for the year 1831. Collection of Michael Zeiler Just three years after the 1831 eclipse map by Gray & Bowen, Charles Bowen produced this follow-up map of the November 30, 1834 total solar eclipse. The curves for the 1834 eclipse were engraved on top of the 1831 path.